Executive Summary
The global rice economy closed Q2 2025 at an estimated USD 472.98 billion, expanding 7.36% CAGR toward USD 678.5 billion by 2030. Asia – Pacific continues to anchor supply and demand, yet geopolitical realignments, record-breaking harvests, and India’s shifting export policies have redrawn trade corridors.
Curious how AI-powered trade and El Niño-driven volatility will reshape jasmine rice prices this Q3? Discover how exporters are adapting in real time.
1. Market Overview in Q2 2025
1.1. Results – Total industry
The global rice market demonstrates remarkable resilience and growth trajectory in Q2/2025, with the industry valued at USD 472.98 billion and projected to reach USD 678.5 billion by 2030. This represents a 7.36% CAGR, reflecting strong fundamentals driven by population growth, urbanization, and rising protein consumption in emerging markets.The market structure reveals significant concentration with Asia-Pacific commanding 47% of global revenues, equivalent to USD 367.1 billion.
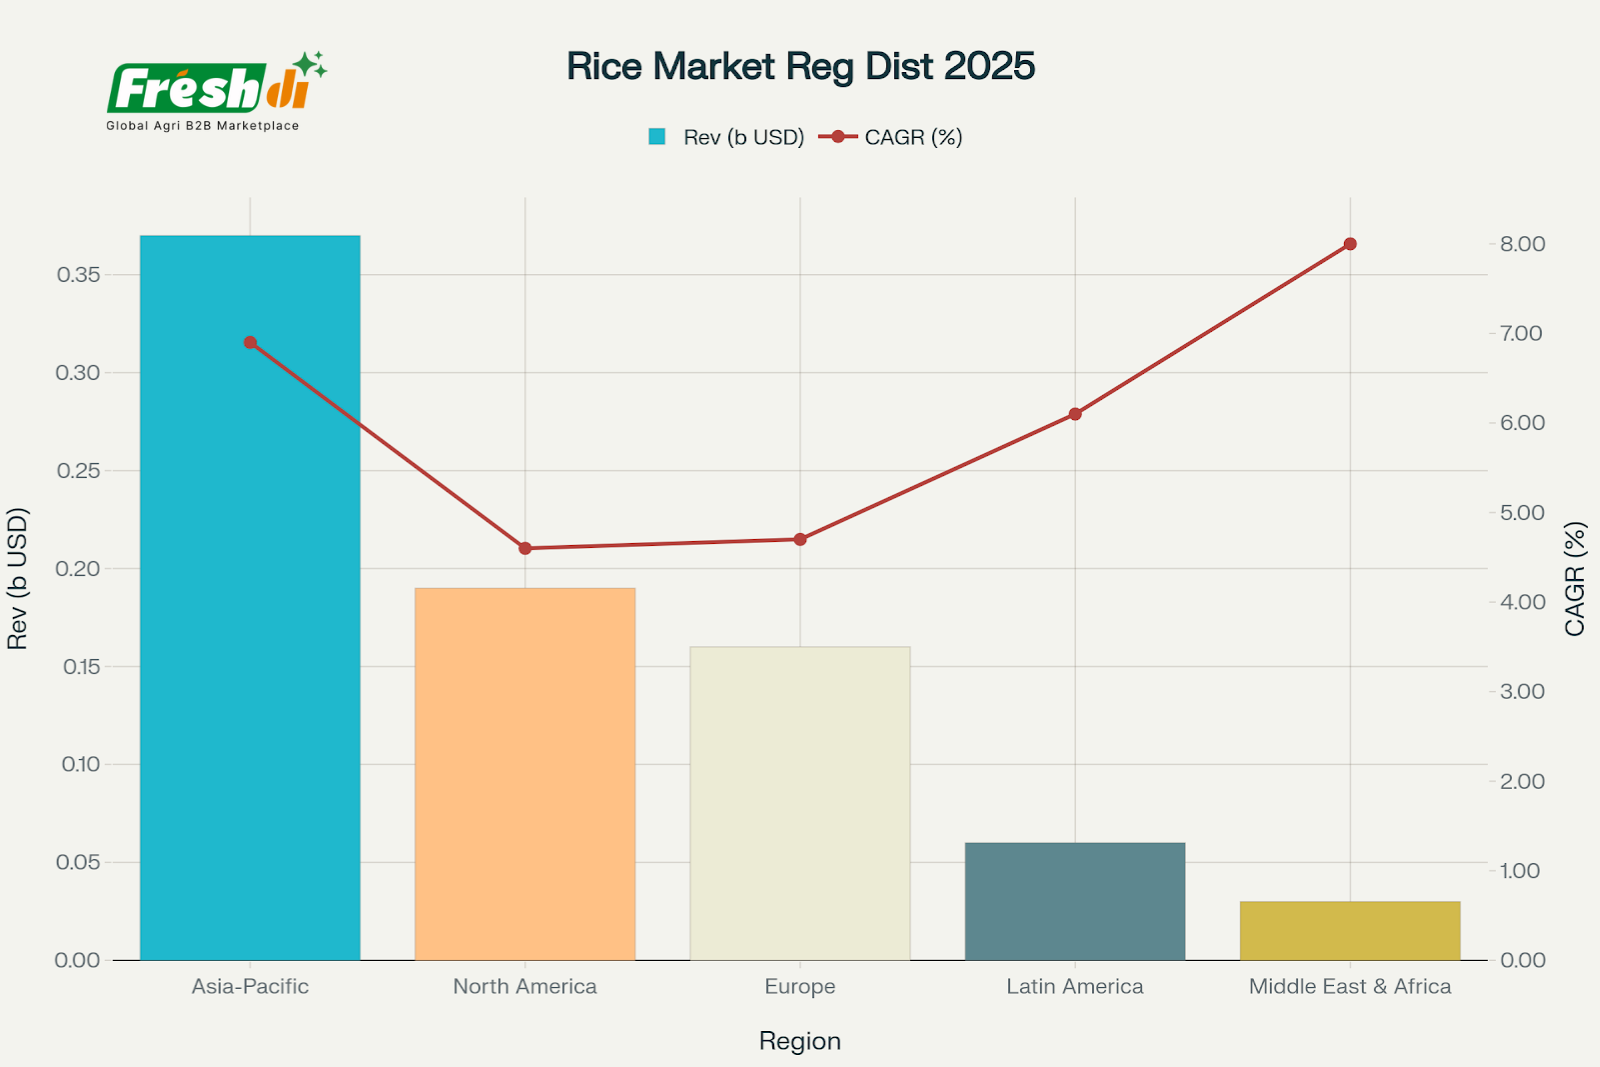
Asia-Pacific dominates in absolute market value, growth hotspots lie in emerging markets like Middle East, Africa, and Latin America. Exporters and food suppliers can leverage this trend via sustainable sourcing, local warehousing, and platforms like Freshdi.com to gain early mover advantages.
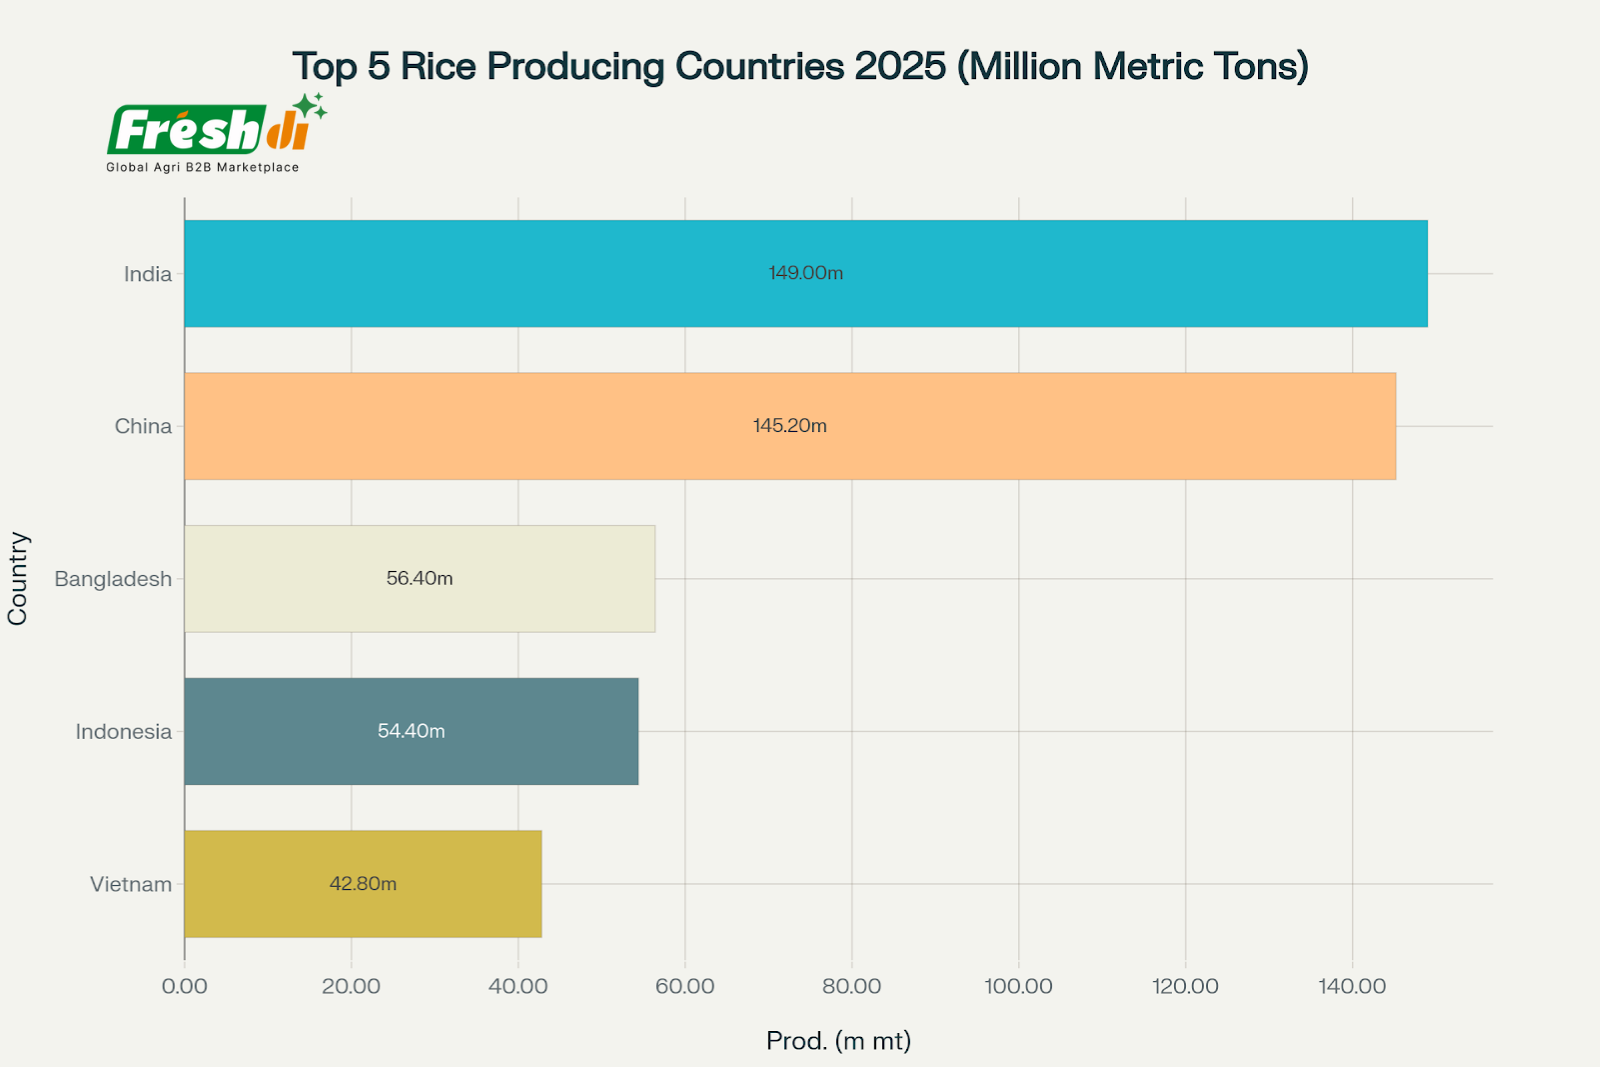
Combined, these five countries contribute nearly 70%+ of global rice output.
Global Production Highlights:
- India: 149.0 million tons (27.5% of global production)
- China: 145.2 million tons (26.8% of global production)
- Bangladesh: 56.4 million tons (10.4% of global production)
- Indonesia: 54.4 million tons (10.0% of global production)
- Vietnam: 42.8 million tons (7.9% of global production)
Total global production: 541.6 million tons (milled basis) in 2025/26
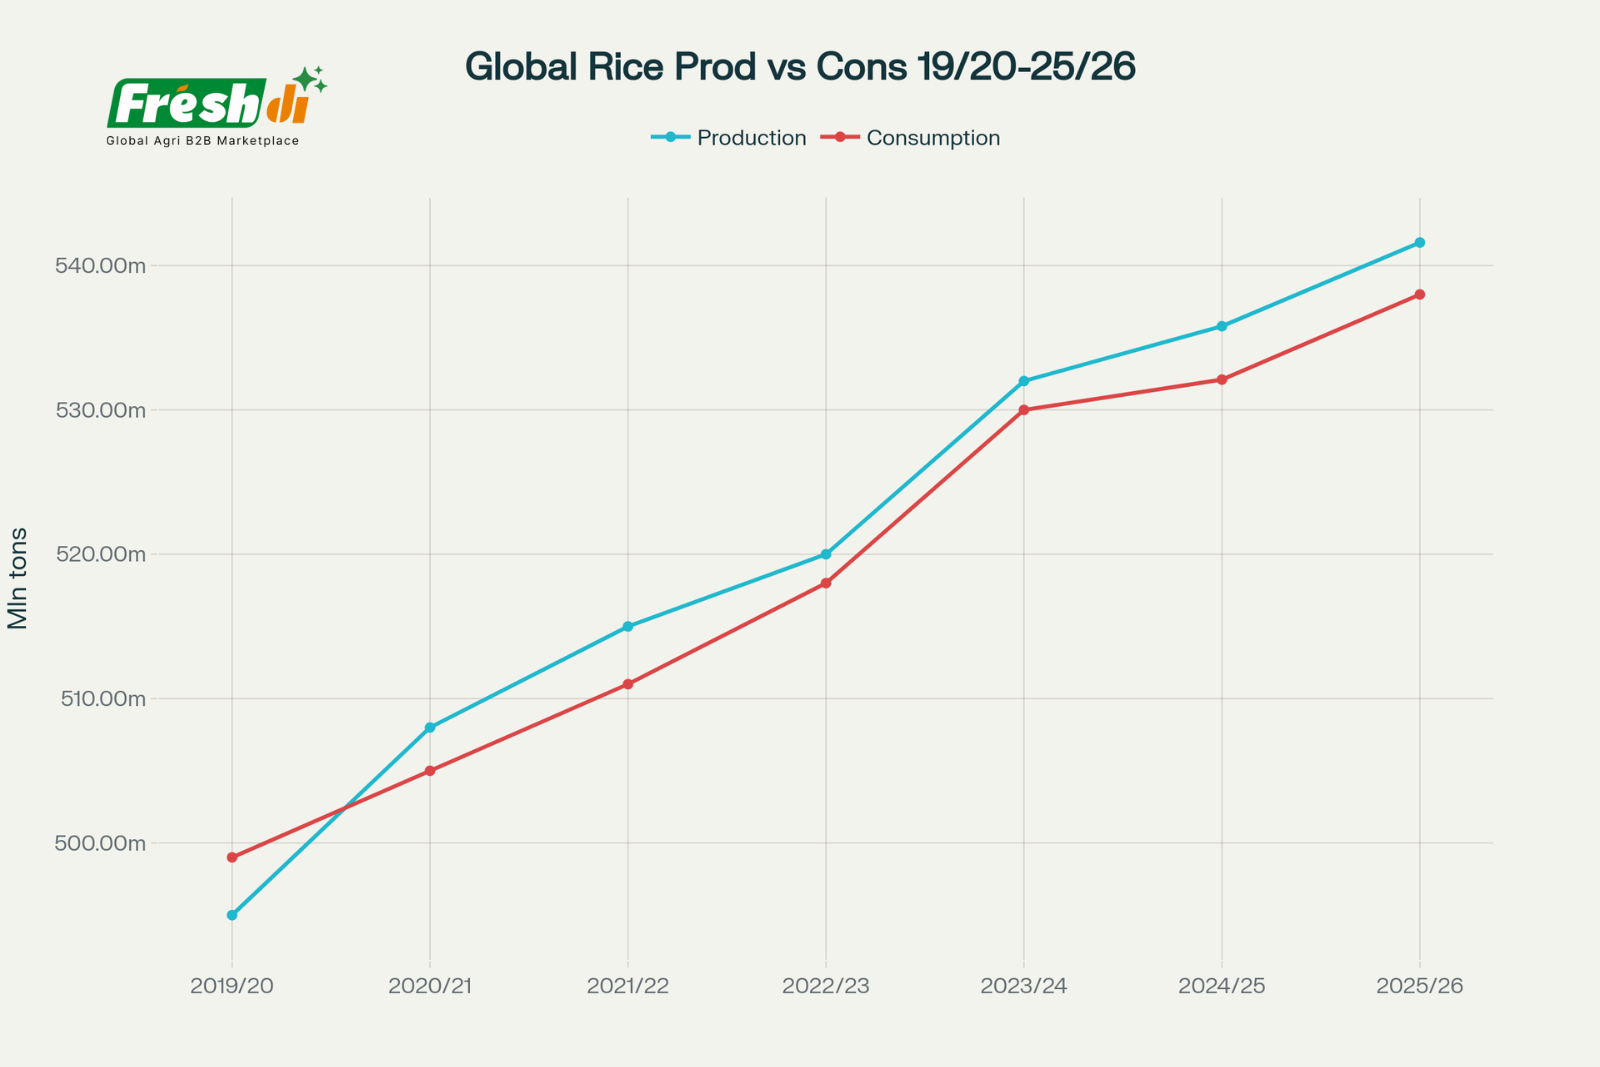
Global rice production remains slightly ahead of consumption through 2025/26, but narrowing margins hint at future supply tensions amid rising demand.
Global rice production rose from just under 500 million tons in 2019/20 to over 545 million tons in 2025/26, consumption mirrors this trend, growing from ~498 million tons to ~538 million tons during the same period.
Surplus Maintained but Narrowing Slightly. The gap between production and consumption remains positive (production > consumption), ensuring global supply stability. However, the gap narrows slightly after 2023/24, signaling tightening margins due to rising demand.
1.2. Analysis
a. Market Segmentations & Regional Analysis
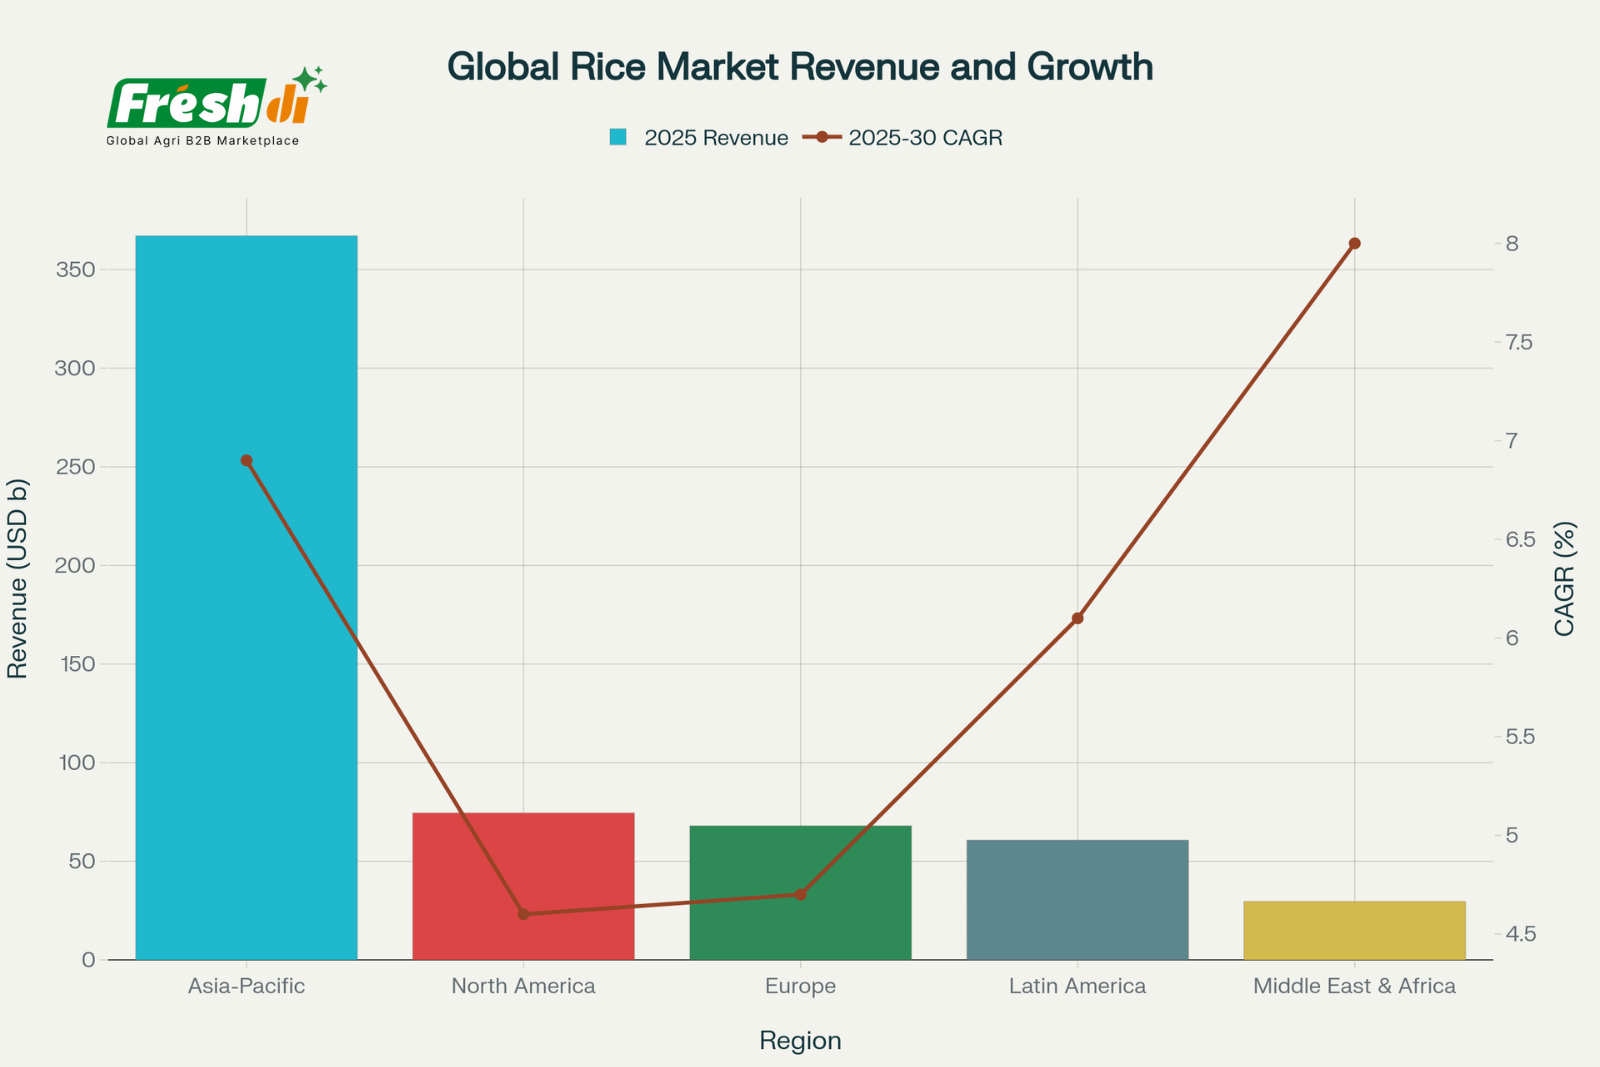
Asia-Pacific dominates current revenue, but Africa and Latin America are set to drive the fastest growth in global rice trade by 2030
| Region | 2025 Revenue (USD bn) | Share of World Value | 2025 Production (Mt, milled) | Share of World Volume | 2025–30 CAGR (Value) |
|---|---|---|---|---|---|
| Asia-Pacific | 367.1 | 47% | 407.5 | 75% | 6.9% |
| North America | 74.5 | 15.7% | 9.2 | 1.7% | 4.6% |
| Europe | 68.0 | 14.4% | 3.9 | 0.7% | 4.7% |
| Latin America | 60.7 | 12.8% | 16.8 | 3.1% | 6.1% |
| Middle East & Africa | 29.6 | 6.3% | 27.2 | 5% | 8.0% |
The global rice market exhibits distinct regional characteristics, with Asia-Pacific maintaining overwhelming dominance while other regions show varied growth patterns and consumption preferences. For Africa & Latin America, despite lower 2025 revenues (USD 29.6b for MEA and USD 60.7b for LATAM), their projected CAGR (2025–2030) up to 8% and 6.1%, showcases strong demand growth, urbanization trends, and dietary shifts.
“While Asia grows the most rice, Africa and Latin America will grow the fastest in value. That’s where the next frontier of global rice trade lies — and where Freshdi.com is empowering verified suppliers to win first mover advantage.”
b. Economic Influencing
Global Economic Growth: World GDP grew at 3.1% in 2025, providing modest tailwinds for rice demand, especially in import-dependent regions of Sub-Saharan Africa and South Asia.
Rising Middle Class: Urbanization and expanding middle classes, particularly across Asia and Africa, continue to drive per capita rice consumption and create demand for higher-value segments such as aromatic and fortified rice.
Food Service Recovery: A 7.5% increase in worldwide foodservice spending in 2025 supported growth in processed and convenience rice markets, offering new opportunities for food wholesale product sellers and exporters.
c. Geopolitical Trade Dynamics
| Region | 2025 Revenue (USD bn) | Share (%) | 2025 Production (Mt, milled) |
|---|---|---|---|
| Asia-Pacific | 223.0 | 47 | 407.5 |
| North America | 74.5 | 15.7 | 9.2 |
| Europe | 68.0 | 14.4 | 3.9 |
| Latin America | 60.7 | 12.8 | 16.8 |
| Middle East & Africa | 29.6 | 6.3 | 27.2 |
- Export Leadership: India’s record harvest and policy shifts (lifting a 2024 ban, targeted MEP for non-Basmati) enable the country to target 22 million tons of exports, exerting downward pressure on global FOB prices, benefitting importers but compressing margins for exporters.
- Currency Movements: The strong USD pushed Thai FOB export quotes below $400/t, increasing competitiveness, while the Indian rupee’s continued strength trimmed exporter profits despite higher volumes. Currency volatility remains a key margin variable for all agricultural exporters.
The rice market operates within a complex geopolitical environment characterized by trade tensions and policy shifts. US-China trade friction has created opportunities for alternative suppliers, particularly in ASEAN and Latin America.
- India’s export policy shifts creating market volatility
- ASEAN near-shoring benefiting from trade diversification
- Currency volatility affecting major producers
- Trade agreement renegotiations reshaping traditional partnerships
c. Climate change and Season Imapcts
| Factor | Impact Zone | Effect on Market |
|---|---|---|
| Heatwaves & Drought | India, Thailand | Reduced yields, export restrictions |
| Rainfall Disruption | Vietnam, Myanmar | Delayed harvest, crop loss |
| Salinity Intrusion | Mekong Delta | Reduced arable land for rice |
| Late Frosts | U.S. (Arkansas) | Replanting costs, slight production drop |
| El Niño | Entire Asia-Pacific | Regional output declines, price pressure upward |
Climate change has emerged as the most significant disruptor in the rice sector, fundamentally altering production patterns and pricing dynamics. El Niño effects continue to impact major growing regions, with Indonesia experiencing irregular rainfall patterns while India benefits from above-normal monsoon conditions.
Climate-Related Challenges:
- Irregular monsoons disrupting traditional growing cycles
- Water scarcity affecting irrigation-dependent cultivation
- Temperature fluctuations reducing yields in climate-sensitive regions
- Extreme weather events creating supply chain disruptions
2. Market Forecast Q2 – Q3/2025
2.1. Revenue Outlook
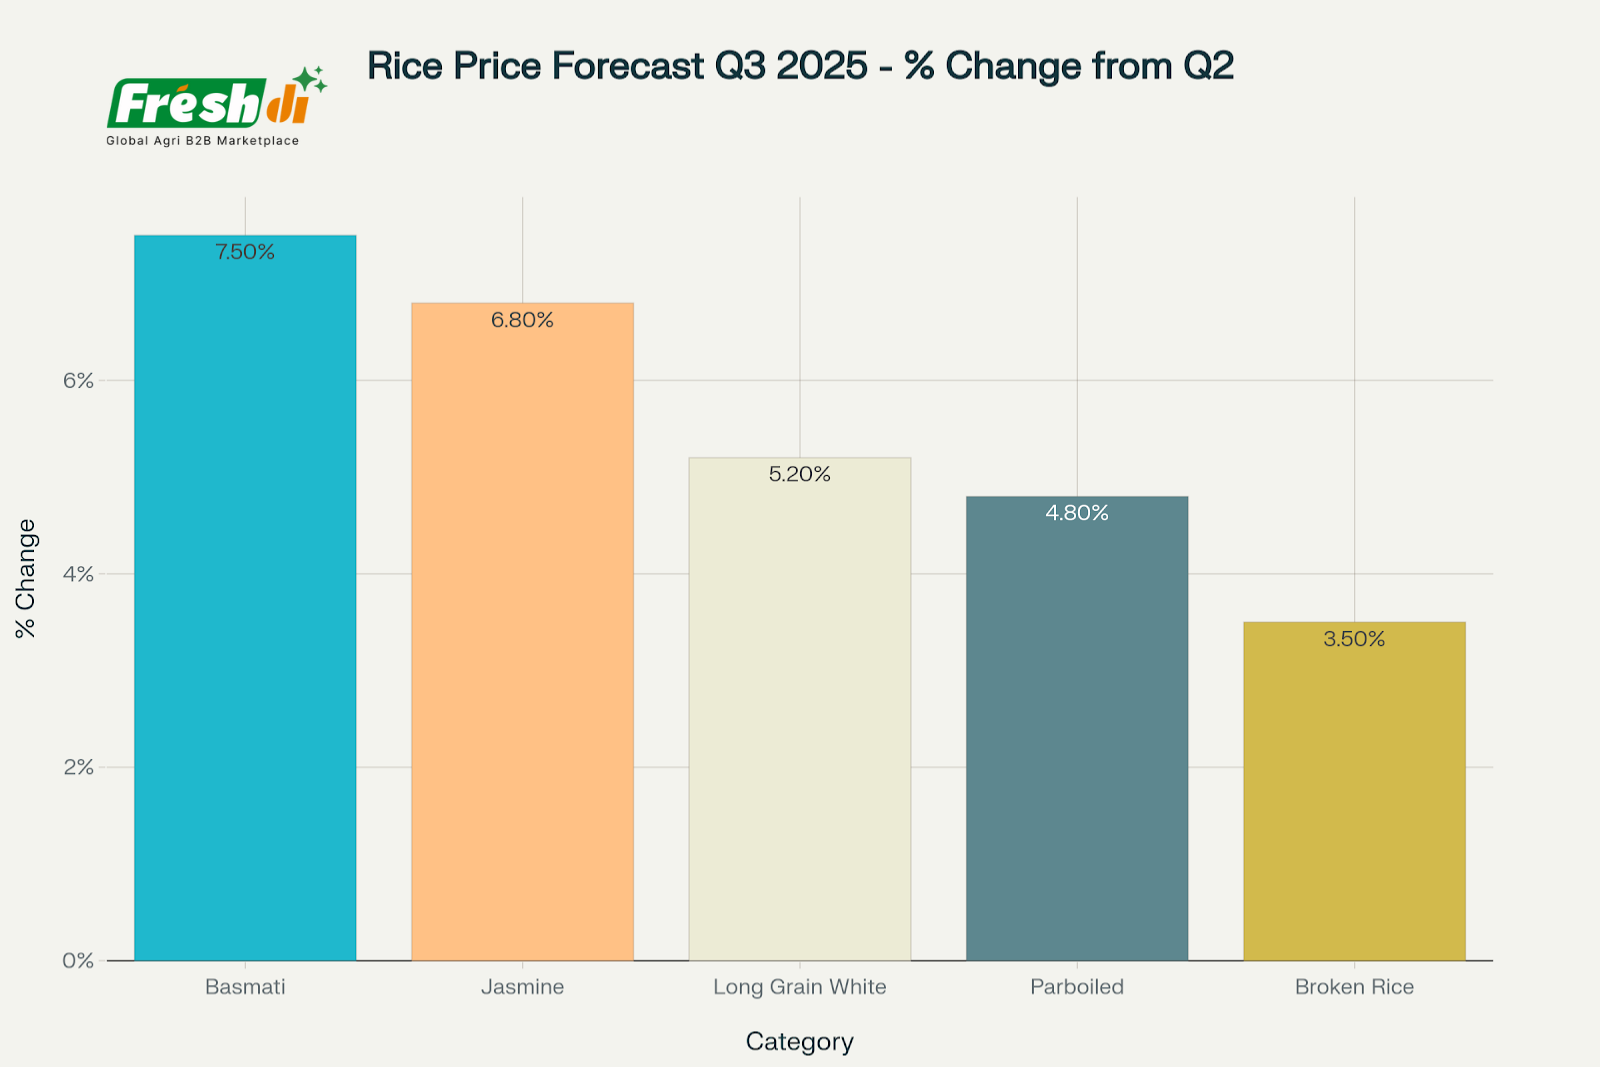
Based on comprehensive market analysis and forward indicators, Q3/2025 price forecasts indicate continued upward pressure across all major rice categories, with premium varieties leading increases.
The Q3-Q4 rice market isn’t just about supply and demand—it’s about risk navigation. From export bans to climatic shifts, buyers are moving early, and sellers must adapt to pricing volatility, logistic delays, and shifting buyer preferences.
Price Trajectory (FOB, US $/t)
Prices for standard white rice appear to have found a floor near US $390/t; only an extreme weather shock or another export suspension could propel values above US $420 t in Q4. Aromatic grades should stay firm on supply tightness and income-elastic demand.
2.2. Forecast Analysis
- Freight: Main-lane container rates are down 18% YoY, yet reefer surcharges sit 28% above 2022; Red Sea rerouting still adds 11 days and ~US $12-14 t to West-African CIF values.
- Inputs: Fertiliser +7%, fuel −17% YoY; on net, farm-gate margins compressed only in exporters facing strong local currencies (Thailand, Pakistan).
- FX Sensitivity: USD strength versus THB and VND keeps Thai and Vietnamese quotes competitive; INR firmness blunts margins on India’s aggressive volumes.
Supply-Chain & Policy Watch-list (Q3-Q4)
Strategic Implications for Stakeholders
- Bulk Supplier / Exporter – Lock Q3 aromatic premiums via forward contracts; hedge freight with bunker adjustment clauses; diversify origination (Pakistan, Cambodia) to offset Indian policy risk.
- Food Wholesale Product Seller / Distributor – Utilise Freshdi.com RFQ engine for dynamic sourcing; capitalise on 5% broken price floor to build inventories before Q4 festive demand uptick.
- Agriculture Export Company – Invest in AWD adoption and blockchain-verified ESG metrics to defend EU and GCC shelf space ahead of 2026 CBAM roll-out.
- Importer / Food Company – Monitor monsoon progress (India onwards); stagger purchases to exploit possible Q3 price dips but secure aromatic coverage early.
- B2B Marketplace Operator – Expand verified supplier pool in Pakistan, Cambodia and West Africa; deploy AI freight estimator to help buyers model Red-Sea route alternatives via Freshdi.com
The disruption environment is creating opportunities for agriculture companies and food wholesalers. Freshdi.com is a trusted global B2B marketplace connecting verified agriculture suppliers and global buyers across the agriculture products in another 200+ countries.
NEXT PART: Innovations, Long & Short-Term Trends; Conclusion and Full PDF Report
About us
Freshdi.com is the world’s leading global B2B marketplace for agricultural products and food, connecting directly between global buyers and suppliers. Freshdi.com has over 3M+ suppliers, 2M+ active buyers, and 1,000+ buying requests updated daily in agri-food.
For rice global buyers, Freshdi.com helps you connect with verified suppliers worldwide.
With Freshdi, I don’t wait – I act:
https://freshdi.com/buyer-category/Rice
For coffee and coffee bean global suppliers, Freshdi.com helps connect directly with buyers via platform or direct communication — no middlemen.
No more wasting time — only real sourcing leads:


.png)