Freshdi Market Insight
Make smarter Tea sourcing decisions with real market data
India (17.4%) and Vietnam (17.1%) lead the 304 Tea suppliers, with Sri Lanka at 9.9%, so the majority of supply comes from just a few nations, limiting origin flexibility. The typical range is USD 1,196 - 3,950 per metric ton FOB, centered at a USD 2,303 median, meaning buyers must evaluate grade and origin to find a match within budget. Buyer inquiries fell 94.4% to 7 in the last 30 days. Buyers request FOB more often than suppliers offer it — a 15.2 percentage point gap — so a FOB price must be explicitly asked for.
What is in this market?
The size and shape of Tea on Freshdi before you shortlist anyone: how many sellers, how much product, how many origins, and which way demand is moving.
1,079supply
Freshdi lists 1,079 active Tea supply listings as of 3 November 2026.
304companies
Freshdi has 304 active Tea suppliers, 2.2% of all suppliers on the platform, as of 3 November 2026.
48origins
Freshdi Tea suppliers come from 48 countries, led by India at 17.4%, as of 3 November 2026.
-94.4% over 12m
Freshdi received 7 buyer inquiries for Tea in the 30 days to 3 November 2026, down 94.4% from the previous 30 days.
304 suppliers are actively offering Tea on the platform, creating a competitive landscape where buyers can compare pricing, certifications, and lead times. This level of supplier participation means there’s room to negotiate and evaluate options without relying on a single source, giving buyers more control over their sourcing decisions. 1,079 listings are currently active, covering a wide range of tea types, grades, and packaging options. With such depth, buyers can quickly find a match for their specific needs—whether it's a particular blend, origin, or packaging size—without having to start from scratch with a custom request. Tea is sourced from 48 countries, offering a broad global footprint. This diversity means buyers can explore different regional profiles, origins, and quality characteristics, which is especially valuable for those seeking unique flavor notes or specific certifications not commonly found in a single region. Only 7 buyer inquiries came in over the last 30 days, a dramatic 94.4% drop compared to the previous month. This sharp decline suggests reduced demand at the moment, which could mean lower competition for available suppliers and potentially more favorable terms for buyers who act quickly.
Freshdi recorded 96 buyer requests for Tea globally in the 365 days to 3 November 2026.
- Freshdi lists 1,079 active Tea supply listings from 304 suppliers in 48 countries, drawn from 73 source documents and 530 supply observations over the 365 days to 3 November 2026.
- Buyer inquiry volume for Tea on Freshdi declined 94.4% in the 30 days to 3 November 2026 against the 30 days before, with 120.43% volatility in monthly inquiry and quotation activity over 359 days.
- Freshdi received 96 buyer requests for Tea in the 365 days to 3 November 2026 against 1,079 active listings — 11.2 listings per request globally.
Who exactly is selling?
The verified Tea suppliers buyers actually reach on Freshdi, ranked by the inquiries they received in the last 30 days and how reliably they answered them.



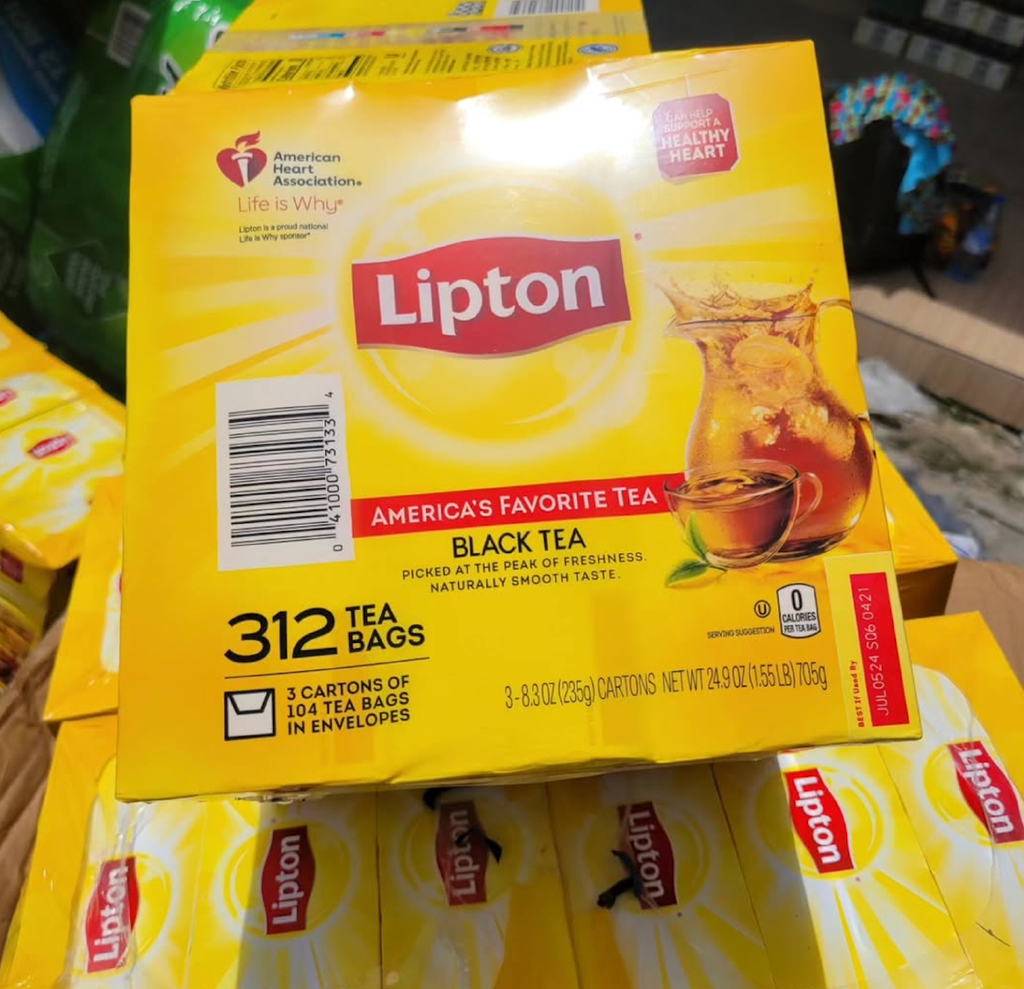
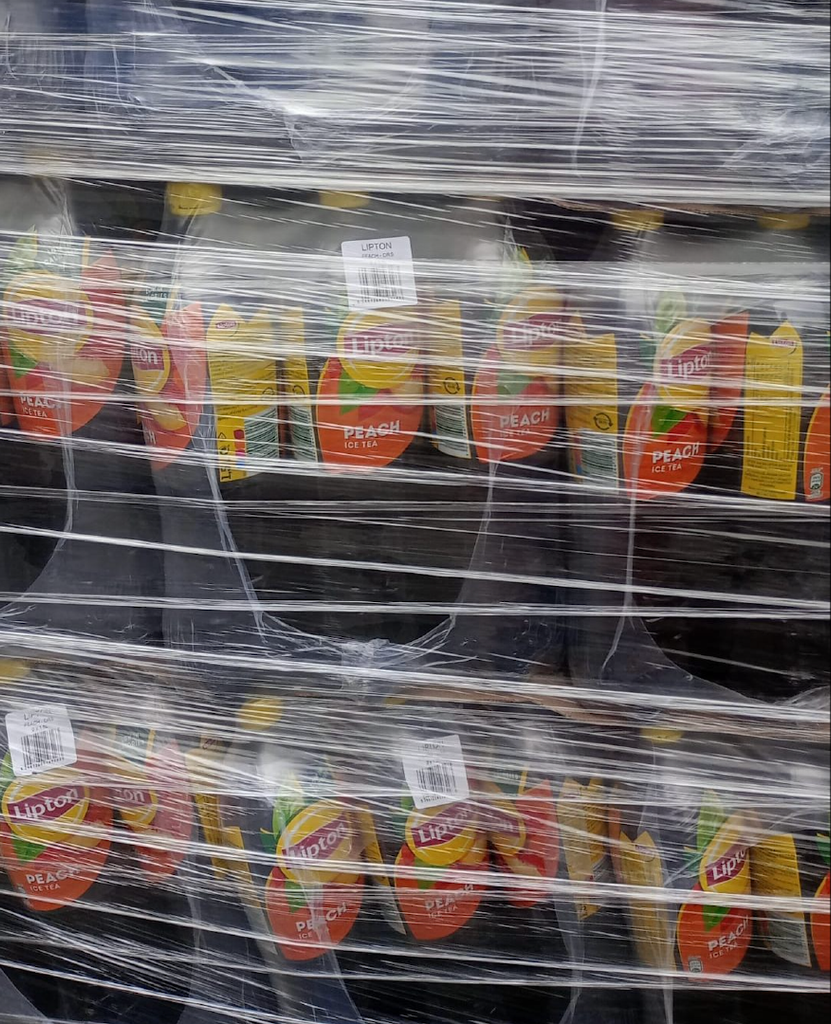
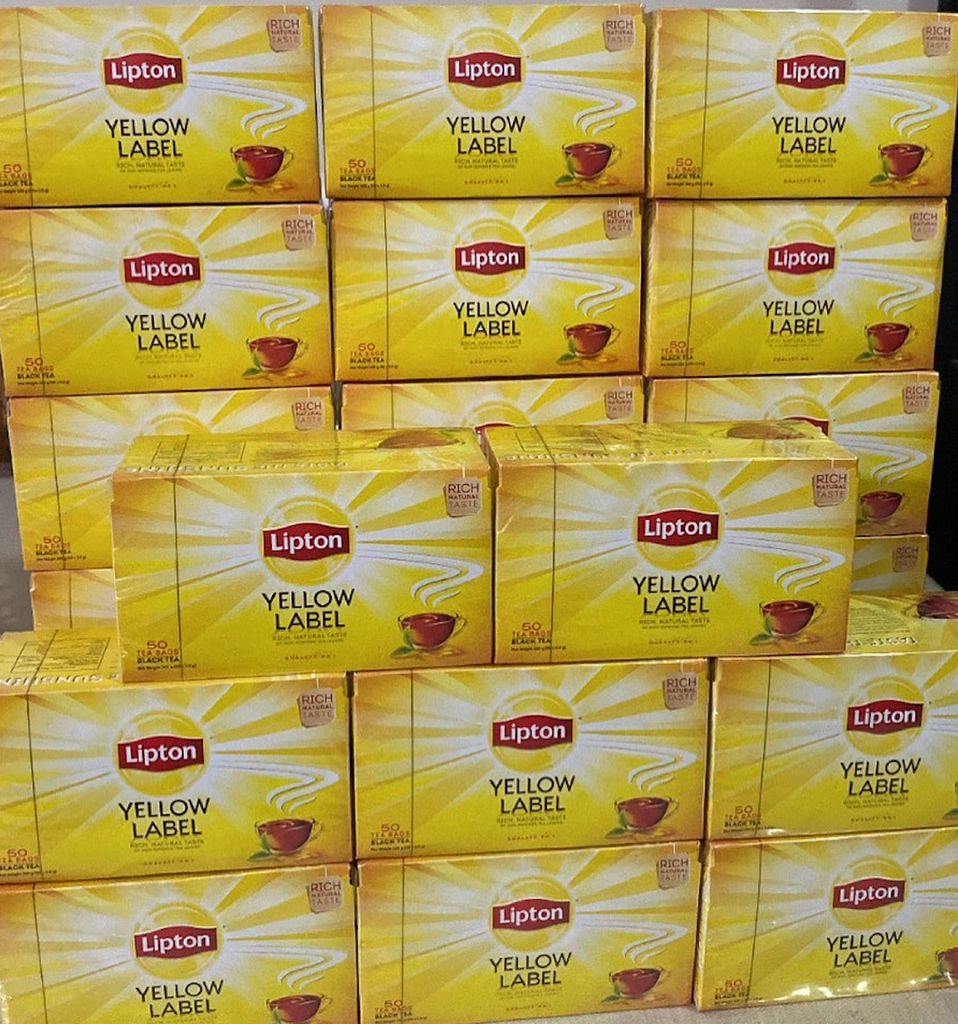
Verified suppliers first, then by buyer inquiries received in the last 30 days, then by response rate. No supplier pays for placement in this list.
Certifications shown are the two or three most relevant per supplier — the full set is on each supplier's profile.
- The most-contacted verified Tea supplier on Freshdi received 0 buyer inquiries in the 30 days to 3 November 2026 and replied to 91% of them.
- 1 of the 304 Tea suppliers on Freshdi are Level 2+ verified with a response rate of at least 70%, as of 3 November 2026.
How stable is this supply base?
Three separate questions, answered in order: is the product fresh, is the market busy, and can the sellers be trusted.
Is there much new product?
Tea gained 55 new listings in the last 30 days, more than the 43 the month before. New offers are arriving at a faster rate than a month ago, so the catalog a buyer browses today includes more recent prices or pack sizes. Compare the listing date when evaluating similar offers to see which one is closer to today’s market.
Is the market busy?
14 of the 304 suppliers joined in the last 12 months, mostly long-standing suppliers. The pool is dominated by sellers with a history of consistent listings, which makes it easier to assess reliability over time. Review each supplier’s listing history before reaching out to confirm consistency.
3712.2% of 304
5016.4% of 304
5819.1% of 304
Can these suppliers be trusted?
248 of 304 suppliers are verified, at least three in four, so buyers can contact several verified suppliers at once. Certificates are held by 105 of 304 suppliers, and HALAL is the most common, held by 17 of them. For a shipment requiring HALAL certification, filter the list to include only those suppliers who hold it.
- Freshdi refreshed 187 of 1,079 Tea supply listings (17.3%) within 90 days to 3 November 2026, and 55 (5.1%) within 30 days.
- 198 of 304 Tea suppliers on Freshdi (65.1%) were active in the 12 months to 3 November 2026, with 37 (12.2%) active within the last month, and 14 suppliers registered during the year.
- 81.6% of Tea suppliers on Freshdi are verified as of 3 November 2026.
- Among 105 certified Freshdi Tea supplier profiles, 16.2% hold HALAL, 13.3% hold HACCP, 10.5% hold FDA_REGISTRATION, 9.5% hold ISO, and 9.5% hold ISO22000; a profile can hold more than one certificate.
What are the selling conditions, and where do the two sides disagree?
Part A reads the supply side on its own terms — price, trade term, MOQ, origin. Part B puts buyer demand next to it and measures the gaps in percentage points.
Default settings of a typical Tea offer — how it ships, what it costs, the smallest quantity accepted and where it comes from. Each figure is drawn from every quote in the last 365 days, not from one seller.
FOB29.5%
FOB is the leading trade term for Tea supply on Freshdi at 29.5%, followed by CIF at 24.9% and EXW at 21.6%, as of 3 November 2026.
1196–3950
USD/MT FOBTea supply on Freshdi typically lists between USD 1,196 and 3,950 per metric ton on a FOB basis, median USD 2,303 across 76 listings, as of 3 November 2026.
0.1MT median
The typical minimum order quantity for Tea on Freshdi is 0.1 MT, with most listings between 0.01 and 1 MT, as of 3 November 2026.
48countries
India (17.4%), Vietnam (17.1%) and Sri Lanka (9.9%) lead Tea supply origins on Freshdi, as of 3 November 2026.
Tea listings show a typical price range of USD 1,196 - 3,950 per metric ton on an FOB basis, with the median landing at USD 2,303. Herbal is the largest-listed variety at 26.3% of priced listings, with a median price of USD 4,000 per metric ton, indicating that price varies significantly by type. The typical minimum order quantity for Tea is 0.1 MT, with most listings falling within the range of 0.01 to 1 MT, offering buyers highly flexible and small-scale order options. Tea suppliers offer FOB at 29.5% and CIF at 24.9%, with FOB the leading trade term among listings. For Tea, payment is primarily made via T/T at 40%, followed by L/C at 24.1%, showing a strong preference for bank transfer as the payment method.
| Type | Range (P25–P75) | Median | N | Term | MOQ |
|---|---|---|---|---|---|
| herbal | 3200–19875 USD/MT | 4000 | 20 | FOB | 0.1 MT |
| Market | Demand | Supply | Offers/req |
|---|---|---|---|
| Global | 614 requests | 73 products | 0.1 |
| USMCA | 148 requests | 73 products | 0.5 |
| United States | 137 requests | 73 products | 0.5 |
| Middle East & North Africa | 68 requests | 73 products | 1.1 |
| ASEAN | 48 requests | 73 products | 1.5 |
Worldwide, 73 listings meet 614 buyer requests - 0.1 listings per request, so buyers compete for the listings on offer. The USMCA sends 148 requests (24.1%), and there the same 73 listings make 0.5 listings per request. With fewer listings than requests, suppliers can be selective about which requests they answer.
FOB is the clearest mismatch: 44.7% of buyer requests ask for it, but only 29.5% of listings offer it (132 supply vs 288 demand observations). EXW runs the other way - 21.6% of listings against 1.7% of requests. A supplier able to quote FOB stands out.
T/T is the widest payment gap: more than half of buyer requests (61%) ask for it, but only 40% of listings accept it (135 supply vs 217 demand observations). PayPal runs the other way - 12.2% of listings vs 2.1% of requests. Suppliers that accept T/T stand out to these buyers.
| Tea type | Buyer range | Median | Supplier range | Median | Gap |
|---|---|---|---|---|---|
| Herbal | 18000 – 18000 | 18000 | 3200 – 19875 | 4000 | -77.8% |
Tea buyers price at a USD 2 median across 8 buyer prices, below the USD 2,302.89 supply median (76 observations) - expect negotiation on the first quote.
India has 12 requests and 15 listings - more listings than requests (0.8 requests per listing), so buyers have choice. Kenya has 9 requests and 1 listing - 9 requests per listing, more requests than listings.
- Buyers price Tea at a USD 2 median across 8 buyer prices on Freshdi, below the USD 2,302.89 supply median across 76 listings, as of 3 November 2026.
- For Tea on Freshdi, FOB is the widest trade term gap - 44.7% of buyer requests against 29.5% of listings - while EXW runs the other way at 21.6% of listings against 1.7% of requests, as of 3 November 2026.
- For Tea on Freshdi, T/T is the widest payment term gap - 61% of buyer requests against 40% of listings - while PayPal runs the other way at 12.2% of listings against 2.1% of requests, as of 3 November 2026.
- Freshdi had 73 Tea listings against 614 buyer requests (0.1 listings per request), and buyers in USMCA posted 148 of them (0.5 listings per request), in the 90 days to 3 November 2026.
- Tea buyer requests on Freshdi asked for India 12 times against 15 listings, Kenya 9 times against 1 listings and China 8 times against 2 listings, in the 90 days to 3 November 2026.
- The United States (137), India (45) and the United Kingdom (43) sent the most of the 614 Tea buyer requests on Freshdi with a known buyer country, in the 90 days to 3 November 2026.
What do I do now?
Act on the numbers above — post request, or browse every listing.
Post buying request for Tea
Freshdi received 96 buyer requests for Tea in the last 12 months. Verified suppliers quote against your spec — no platform fees on either side.
Browse all Tea suppliers
1,079 listings from 304 sellers, filterable by type, MOQ, trade term and certification.
The typical minimum order quantity for Tea is 0.1 MT, with listings ranging from as low as 0.01 MT to a high of 1 MT. This flexibility allows small-volume buyers to enter the market, though those requiring larger volumes should verify availability and pricing consistency across different order sizes.
Tea listings show major gaps in trade and payment terms, with FOB demand (44.7%) exceeding supply (29.5%) by 15.2 points. CIF and CFR also show mismatches, with CIF having a 10.8-point gap and CFR a negative gap of -3.1 points. Payment terms reveal a 21-point gap for T/T, while other terms like PayPal and D/P show mismatches that buyers must resolve directly with suppliers.
81.6% of Tea suppliers on Freshdi are verified, totaling 248 out of 304 suppliers, based on platform checks. Additionally, 105 suppliers list a certificate, with HALAL being the most common at 17 suppliers, providing buyers with strong signals of compliance and quality assurance before initiating contact.
Post a buying request detailing your required grade, volume, and destination, or browse live Tea listings directly on Freshdi. Contacting a verified supplier from either path allows you to compare pricing, terms, and certifications before finalizing any order.
Methodology
How the numbers on this page are produced, and what they do not cover.
Every figure comes from Tea listings, supplier quotes and buyer requests posted on Freshdi in the 365 days to 25 October 2026 - 1,079 active listings, 98 buyer requests, 73 source documents, and 530 supply observations from the last 90 days. External export benchmarks are cited separately and never mixed into Freshdi figures.
Price and MOQ ranges are the interquartile range - the middle half of quotes, a quarter below and a quarter above - with the median reported alongside. A Tea type is priced only once it holds at least 5% of supply price quotes and 3 priced listings with a real range; below that it is not listed. Buyer prices are compared only once there are at least 5 of them.
All prices are FOB, in USD per metric ton; quotes on other Incoterms are converted to a FOB equivalent. Freshdi does not hold a CIF price series for Tea, so no landed-cost comparison is possible from this data.
Demand-versus-supply differences in trade and payment term shares are stated in percentage points, and origin rows add buyer requests per listing. Each figure carries its market scope - global - beside the number rather than in a footnote.
Product freshness counts listings created or updated. Supplier activity counts sellers by their last update. The two are different measurements and will not agree.
Freshdi reprocesses market data every hour, with one snapshot a day for trends. This page's figures, certification coverage included, refresh every 14 days on a rolling 365-day window.