
Introduction
Indonesia’s latest reported average price for imported soybeans was Rp13,794 per kilogram on 11 November 2026, according to daily food-price data attributed to the Ministry of Trade’s SP2KP. For export benchmarks, the USDA’s November oilseeds report showed rounded 4 November FOB prices of about US$470 per metric tonne for Argentina, US$480 for the United States and US$490 for Brazil.
These figures describe different points in the supply chain. The Indonesian price is a domestic market observation, while the FOB figures are export-area benchmarks, not offers delivered to Indonesia. This update covers Indonesia’s reported domestic price, export benchmarks available through 4 November, and import and trade data with their reporting periods stated.
Key Takeaways
- Indonesia’s reported imported-soybean price was Rp13,794/kg on 11 November 2026, up 0.01% from the previous daily observation in the SP2KP data reported by Katadata.
- The USDA’s 4 November 2026 export-price chart put FOB Argentina at about US$470/MT, the U.S. Gulf at about US$480/MT and Brazil Paranagua at about US$490/MT. The chart values are rounded benchmarks, not Indonesia-delivered quotations.
- ASEAN’s reported Indonesian CIF soybean price for HS code 12019000 was US$474/MT in March 2026, the latest monthly observation shown in its 2026 table. The table lists US$476 in January and US$489 in February.
- BPS recorded 2.558 million tonnes of soybean imports in 2025. The United States supplied 2.214 million tonnes and Canada 290,416 tonnes.
- USDA’s November 2026 forecast put Indonesia’s soybean imports at 2.925 million tonnes for marketing year 2026/27, compared with 2.987 million tonnes for 2025/26. Buyers should compare equivalent specifications and delivery terms before assessing price.
1. Indonesia’s soybean market depends on imports
Imported soybeans supply most of Indonesia’s market, so domestic prices are exposed to international prices, the rupiah’s exchange rate and shipment costs. BPS recorded 2.558 million tonnes of imports in 2025, down from 2.676 million tonnes in 2024. The same BPS table reports a 2025 CIF import value of US$1.187 billion.
Demand includes soybeans used by tofu and tempeh producers as well as food and feed businesses. USDA’s November 2026 trade table estimates Indonesian soybean imports at 2.925 million tonnes in 2026/27, on an October-to-September marketing-year basis. That is a forecast, not a confirmed shipment total or buyer order.
Origin concentration shapes the choice of alternatives. In 2025, the United States supplied about 2.214 million tonnes and Canada about 290,416 tonnes, while BPS recorded smaller volumes from Uruguay and Brazil. Importers considering another origin should check availability, product specification, shipping schedule and destination costs rather than assuming a benchmark price is a deliverable offer.
Looking to Source Soybean?
Connect with verified suppliers, discover matching products, and explore sourcing opportunities from global markets.
2. Latest soybean prices and comparison by origin
2.1 Indonesia’s latest reported price
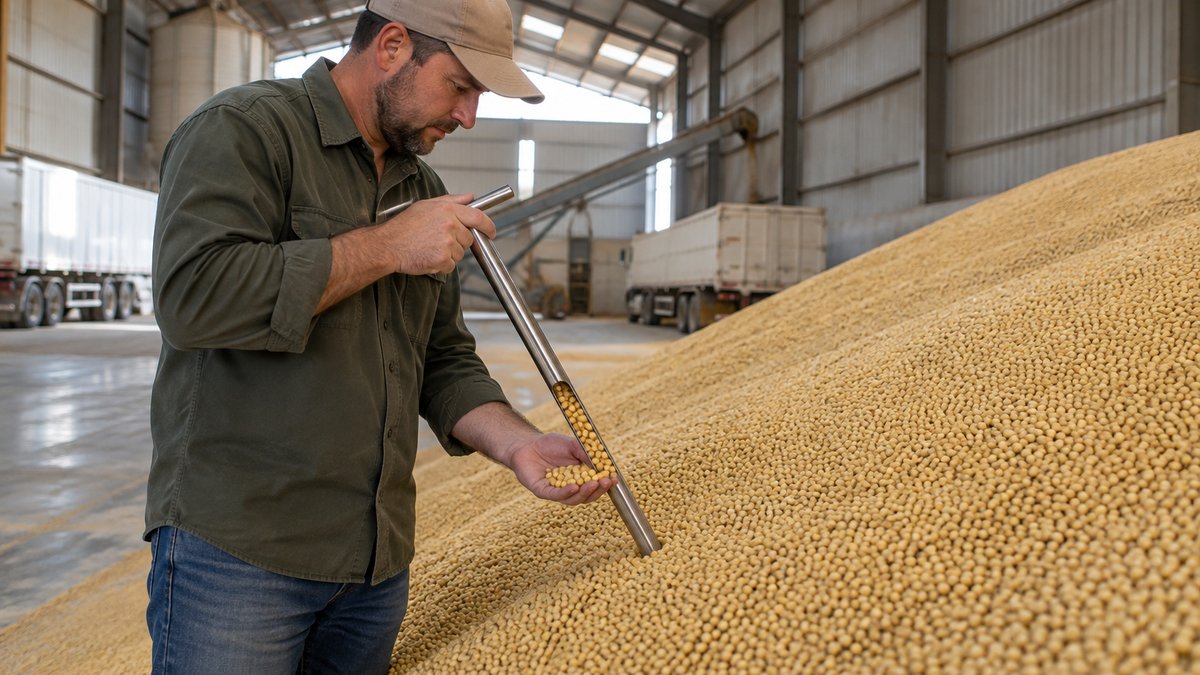
The latest dated domestic price found for this update is Rp13,794/kg for imported soybeans on 11 November 2026. Katadata reported the figure from SP2KP Ministry of Trade data and stated it was 0.01% above the previous daily observation. This is a domestic market price indicator; the source does not identify it as a port-level import offer, a particular soybean grade or a buyer’s contract price.
The latest monthly CIF series located for Indonesia ends in March 2026. ASEAN’s soybean table, using HS code 12019000 and US dollars per tonne, reports US$476 in January, US$489 in February and US$474 in March. Its displayed 2026 average is US$480/MT, based on the months available in the table. April to November entries are marked unavailable, so this average should not be described as a full-year or current November price.
2.2 FOB benchmarks from competing origins
For a like-for-like view of export-area benchmarks, the USDA’s November 2026 report charts soybean prices on FOB bases at the U.S. Gulf, Argentina Up River and Brazil Paranagua. On 4 November, the chart places the rounded prices at about US$480/MT for the U.S. Gulf, US$470/MT for Argentina Up River and US$490/MT for Brazil Paranagua. These are benchmark observations; actual offers depend on shipment timing, contract specification and other terms.
The USDA’s November report says soybean export prices had declined over the preceding month as the U.S. harvest and Brazil’s planting progressed without major issues. It also notes that Brazil retained a seasonal premium over U.S.-origin soybeans, with the gap narrowing as the Brazilian real depreciated after late-October elections. The chart’s rounded origin benchmarks provide a dated comparison, not a complete price history for every grade.
FOB and CIF prices include different cost components. FOB generally covers the goods through loading at the named export port, while CIF includes cost, insurance and freight to the named destination port. Indonesia’s January-to-March CIF series cannot be directly compared with the November FOB chart as if both describe the same shipment date or cost basis.
3. What is changing soybean prices?
Seasonal supply and currency movements are among the factors cited in the latest USDA export-price assessment. The November 2026 report links the recent decline in export prices to progress in the U.S. harvest and Brazil’s planting, and says depreciation of the Brazilian real narrowed Brazil’s seasonal premium over U.S. soybeans.
Indonesia’s import reliance gives international prices and currency conversion a route into local costs. A domestic price in rupiah per kilogram cannot be explained by a FOB benchmark alone: the buyer also needs the exchange rate used for payment, freight, insurance when applicable, port and handling charges, and the cost of moving the product to its final destination.
Demand forecasts add context, but they are not purchase confirmations. USDA forecasts Indonesian soybean imports of 2.925 million tonnes in 2026/27, below its 2.987 million-tonne estimate for 2025/26. Importers should track actual tenders, shipment availability and policy changes separately from a seasonal forecast.
Weather and crop conditions can affect production expectations, but the sources used here do not support a specific Indonesia-focused weather loss or a quantified price effect for November. Buyers should use dated crop information from the relevant producing country before attributing an offer change to weather.
4. Which markets import the most soybeans?
4.1 Major global importing markets
USDA’s November 2026 world trade table puts China well ahead of the other selected markets, with a 2026/27 soybean import forecast of 115 million tonnes. The table also reports forecasts of 13.7 million tonnes for the European Union, 3.3 million tonnes for Japan and 2.925 million tonnes for Indonesia. These are marketing-year forecasts, not final customs data.
The markets in this comparison differ in size and use. China is the largest by a wide margin in the USDA table, while Indonesia is a substantial Southeast Asian destination with a distinct reliance on imported beans for domestic food uses. A global forecast does not establish demand for a specific origin, variety or shipment month.
4.2 Indonesia’s leading supply origins
BPS origin data show that the United States and Canada were Indonesia’s main soybean suppliers in 2025. The U.S. volume was 2.214 million tonnes, compared with 290,416 tonnes from Canada. Uruguay supplied 21,429 tonnes and Brazil 20,997 tonnes. These are reported import quantities for calendar 2025, not the shares of orders currently being negotiated.
BPS also reports CIF values by origin. Those annual customs values can help describe recorded trade, but they are not current supplier offers. The product mix, shipment dates and contract terms behind the annual totals are not a substitute for a current quotation.
4.3 What import demand means for exporters
The import forecast supports Indonesia’s relevance as a destination, while the origin table shows established U.S. and Canadian supply channels. Exporters evaluating the market need to confirm the buyer’s intended use, required quality, quantity, packaging and delivery point. A national forecast indicates aggregate trade expectations; it does not prove that a particular buyer is seeking a particular origin.
5. How buyers can compare soybean offers for Indonesia
Buyers should compare offers against one written specification and one delivery basis. A lower FOB number may not produce a lower delivered cost once freight, insurance, handling, inland transport and import requirements are considered.
- Confirm the product description, origin, grade and intended use. Food-grade beans for tofu or tempeh may require different selection criteria from beans bought for crushing or feed.
- Request the same quantity, shipment window, packaging and quality parameters from each supplier. Ask which test results and tolerances form part of the offer.
- Record the named port and Incoterms® rule with the edition and place stated. FOB, CFR and CIF quotations do not cover identical costs or responsibilities.
- Convert currencies using the same dated exchange-rate basis, then add the costs that apply between the export port and the buyer’s facility.
- Check import documentation and applicable Indonesian requirements for the product and shipment before treating a quotation as ready to purchase.
The benchmark gap on 4 November was about US$20/MT between the Argentina and Brazil chart values. That difference is a useful prompt for requesting comparable offers, not proof that Argentine soybeans would arrive in Indonesia at the lowest cost. Freight route, timing, lot specification and final delivery terms can change the comparison.
Buying consideration: Ask each supplier to quote the same specification and destination basis, then compare the documented landed-cost components instead of ranking offers by FOB price alone.
6. What does the latest demand look like on Freshdi?
No dated Freshdi soybean request statistics or individual buying requests are available for this article, so it cannot report a current request count, buyer destination mix, quantities or trade terms. The national import forecast and customs figures above describe different sources and must not be presented as Freshdi activity.
Buyers and suppliers can use Freshdi’s soybean category pages to review relevant listings and buying requests. Before responding to a request, suppliers should check its stated origin preference, quantity, destination and delivery terms; buyers should verify that a listing matches their specification and shipment needs.
Freshdi listings and requests are a discovery starting point. They do not confirm a transaction, guarantee that a request remains active or replace checks on product quality, documentation and commercial terms.
7. Practical next steps for soybean buyers and suppliers
7.1 For buyers and importers
- Use the 11 November Indonesian domestic price as a dated market reference, not as a purchase offer or a port-specific import price.
- Compare current origin quotations with matching specifications, quantities, shipment windows and delivery terms.
- Request the supplier’s dated offer and clarify how long the price remains valid, since market benchmarks can move between assessment and contract.
- Calculate landed cost in the same currency and at the same destination for each origin.
- Confirm import requirements and documents for the specific product and shipment before signing.
7.2 For exporters and suppliers
- State the soybean origin, grade, intended use, available quantity and packaging in the offer.
- Name the loading port, delivery term, shipment window, currency and quotation validity.
- Provide relevant quality information and documents only when they are available and applicable to the goods offered.
- Review current buyer requirements before preparing a quotation, and respond only when the product and shipment terms fit.
8. How Freshdi helps buyers and suppliers connect
Freshdi provides product-category pages where buyers can review potential suppliers and suppliers can review buying requests. For Indonesian soybean sourcing, use those pages to identify listings or requests that warrant a closer specification and commercial check.
Buyers can begin with soybean suppliers and compare stated product details before making enquiries. Suppliers can review soybean buying requests and assess whether a request fits their origin, quantity and delivery capability.
After checking the price basis and product specification, buyers and suppliers can review relevant soybean listings and requests on Freshdi.
View Latest Grains, Cereal & Legumes Buying Requests →View Potential Grains, Cereal & Legumes Suppliers →
9. Indonesia soybean market outlook
Indonesia’s reported imported-soybean price stood at Rp13,794/kg on 11 November 2026. The latest FOB comparison located for the month was the USDA’s rounded 4 November benchmark: about US$470/MT for Argentina, US$480/MT for the U.S. Gulf and US$490/MT for Brazil. The separate Indonesian CIF series available here ends in March, so it should not be treated as a November landed price.
The USDA’s November assessment associates the recent export-price decline with U.S. harvest progress and Brazil’s planting, while its 2026/27 forecast keeps Indonesia a major import destination. Buyers should obtain current, specification-matched quotations and calculate delivered cost. Exporters should state the origin, quality, port, shipment window and validity of each offer.
Buyers and suppliers can use Freshdi to review relevant soybean suppliers and buying requests as part of their sourcing checks.
Readers ready to review relevant market listings can visit Freshdi’s soybean supplier and buying-request categories.
View Latest Grains, Cereal & Legumes Buying Requests →View Potential Grains, Cereal & Legumes Suppliers →
Frequently Asked Questions
What was the latest reported soybean price in Indonesia?
Katadata reported an SP2KP Ministry of Trade figure of Rp13,794 per kilogram for imported soybeans on 11 November 2026, up 0.01% from the previous daily observation. It is a domestic price indicator, not a supplier quotation or a port-specific import price.
What were soybean export prices in November 2026?
The USDA’s November 2026 report charted approximate FOB prices on 4 November of US$470/MT for Argentina Up River, US$480/MT for the U.S. Gulf and US$490/MT for Brazil Paranagua. The rounded chart values are benchmarks; an actual offer depends on specification, timing and contract terms.
Why can soybean prices in Indonesia differ from FOB prices?
FOB is an export-port basis, while Indonesia’s domestic price reflects a different point in the chain. Freight, insurance when applicable, exchange rates, port and inland costs, and local market conditions can all affect the price paid in Indonesia.
Which countries supply most of Indonesia’s soybeans?
BPS recorded 2.214 million tonnes from the United States and 290,416 tonnes from Canada in Indonesia’s 2025 soybean imports. Uruguay and Brazil supplied smaller recorded volumes of 21,429 tonnes and 20,997 tonnes, respectively.
How much soybean is Indonesia forecast to import?
USDA’s November 2026 world trade table forecasts 2.925 million tonnes of soybean imports for Indonesia in marketing year 2026/27, which runs from October to September. This is a forecast, not a final customs total or a confirmed order.
How should buyers compare FOB, CFR and CIF soybean offers?
First confirm that the offers cover the same soybean specification, quantity, shipment window and destination. Then compare the costs each delivery basis includes and add the remaining freight, insurance, port and inland charges needed to calculate landed cost. A lower FOB price alone does not establish the lower delivered cost.
References
1. USDA Foreign Agricultural Service – Oilseeds: World Markets and Trade, November 2026.
2. BPS-Statistics Indonesia – Imports of Soybean by Major Country of Origin, 2021-2025, 2026.
3. ASEAN Food Security Information System – ASEAN Agricultural Commodity Outlook No. 36, 2026.
4. Katadata – Today's Food Prices (11/11) in Indonesia: Rice, Soybean, and Chicken Meat Prices Increased, 11 November 2026.
Disclaimer: This article is compiled from platform data, public sources and information provided by third parties, for general informational purposes only. We do not guarantee its accuracy or completeness. Prices, volumes and forecasts are indicative, reflect conditions as of 2026-11-20 and may change without notice. This is not financial, investment or trading advice.