
Introduction
Taiwan imports nearly all the soybeans it uses, so changes in export offers from major origins matter to its crushers, feed manufacturers and importers. The latest public benchmarks located for this update are weekly FOB export prices for Argentina, Brazil and the United States, reported for 12 November 2026.
Those are origin-port prices, not Taiwan CIF quotations or completed sales into Taiwan. This update covers November 2026 market information available through 12 November, with the price comparison kept separate from Taiwan’s import forecasts and historical customs figures.
Key Takeaways
- On 12 November 2026, reported FOB soybean prices were US$501.83 per metric tonne for Brazil Paranagua, US$495.58 for the US Gulf and US$481.71 for Argentina Up River.
- The three benchmarks rose from the previous weekly observations. The reported changes were about 1.8% for Brazil, 2.2% for the US Gulf and 1.8% for Argentina.
- These are export-port benchmarks. They do not include ocean freight, insurance, Taiwan port charges or any buyer-specific quality adjustments.
- USDA’s November 2026 forecast puts Taiwan soybean imports at 2.8 million tonnes for marketing year 2026/27. USDA reported 2.77 million tonnes of imports in MY2024/25.
- Taiwan buyers should request comparable specifications and delivery terms from suppliers, then calculate landed cost to the destination port.
1. Taiwan’s soybean market depends on imported supply
Taiwan relies on imported soybeans for crushing and feed use, with domestic production meeting only a small part of demand. USDA’s Foreign Agricultural Service forecast imports of 2.8 million metric tonnes for Taiwan in marketing year 2026/27, which runs from October to September. The USDA figure is a forecast, not a final customs total.
USDA reported that Taiwan imported 2.77 million tonnes in MY2024/25, 7% more than in the preceding marketing year. For MY2025/26, USDA forecast 2.767 million tonnes. These figures describe import volume, not the price Taiwan buyers paid for each shipment.
The United States and Brazil were the leading suppliers in MY2024/25. USDA reported US shipments of 1.51 million tonnes, or 55% of Taiwan’s soybean imports, and Brazilian shipments of 1.17 million tonnes, or 42%. Canada supplied about 70,000 tonnes, or 3%. These historical shares help explain why the three origins’ export prices are relevant to Taiwan procurement, but they do not establish the origin mix for later periods.
Taiwan’s import competition reflects more than price. USDA’s 2026 Taiwan oilseeds report describes changes in the US and Brazil shares alongside price competitiveness and logistics. It also notes that US shipments can move in bulk or containers, with shipment format affecting the buyer’s delivered economics.
Looking to Source Soybean?
Connect with verified suppliers, discover matching products, and explore sourcing opportunities from global markets.
2. November soybean export prices by origin
The latest dated comparison located for this update is the European Commission’s weekly world export price data for 12 November 2026. The reported benchmarks are FOB at the named export locations and stated in US dollars per metric tonne. They are indicative origin prices, not firm offers to a particular Taiwan buyer.
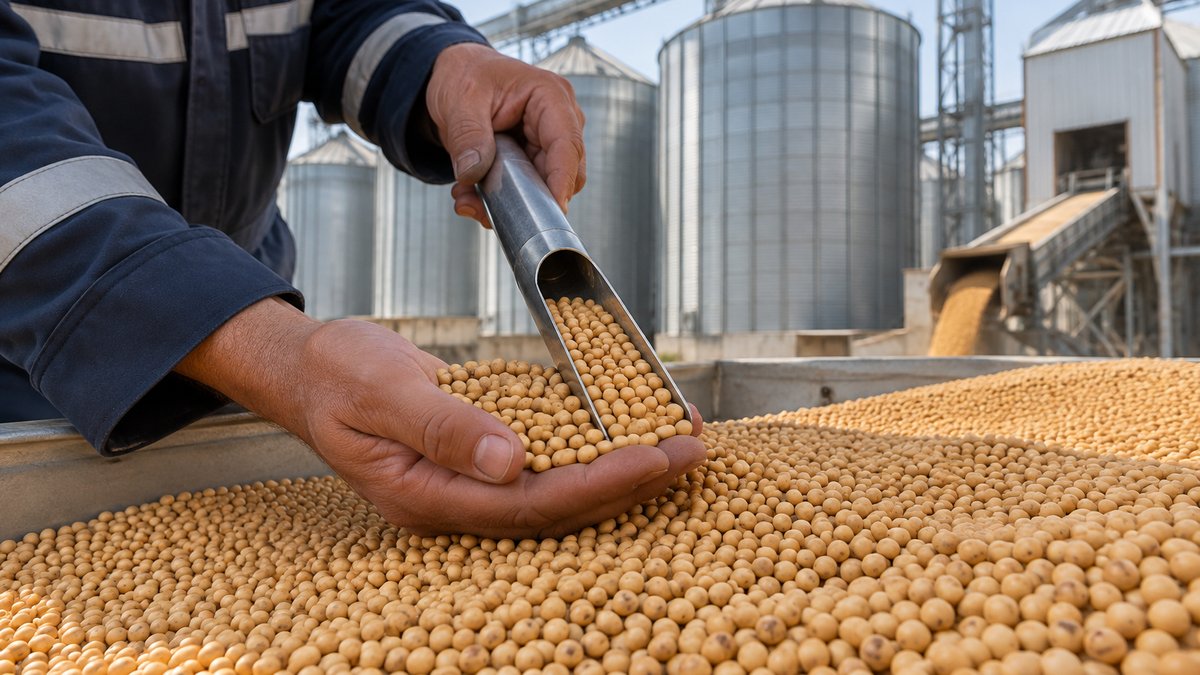
Brazil’s reported benchmark was US$6.25/MT above the US Gulf figure and US$20.12/MT above Argentina’s. The US Gulf figure was US$13.87/MT above Argentina’s. Those are comparisons of the published FOB benchmarks; the data do not establish that shipment specifications, loading conditions or contract terms are identical.
The three benchmarks rose week over week, but a single weekly change does not set a Taiwan buyer’s purchase price. A supplier quote may differ with protein and moisture specifications, crop year, shipment month, lot size, packaging, inspection terms and the precise loading point. Confirm those details before treating two offers as comparable.
The November 2026 USDA oilseeds report also presents International Grains Council soybean export-price series through 5 November for the US Gulf, Brazil Paranagua and Argentina Up River. USDA described prices as having declined over the preceding month as the US harvest and Brazil planting progressed without major issues. The 12 November weekly data show a subsequent rise from the previous observation, so the dates and series should be kept clear rather than merged into one movement.
3. What is changing soybean export prices?
Seasonal supply is one factor behind the November price direction. USDA’s November 2026 market report linked the preceding month’s price decline to the progress of the US harvest and Brazil planting. Harvest availability can change the volume offered by exporters, while planting progress informs expectations about the next crop. Neither factor alone determines a particular supplier’s offer.
Origin and logistics also affect a Taiwan buyer’s alternatives. USDA’s Taiwan report describes a change in supplier shares in MY2024/25, when US imports rose and Brazil’s share fell. It attributes the shift in part to improved competitiveness of US offers and logistics conditions. The report also notes that bulk and containerized shipments have different roles in Taiwan’s sourcing.
Currency movements can influence export competitiveness when a producer sells in local currency and the buyer compares offers in US dollars. USDA’s November oilseeds report said Brazil’s seasonal price premium over US origin narrowed somewhat as the Brazilian real depreciated in late October. That is an explanation of the reported market movement, not a prediction that the premium will continue to narrow.
Import demand matters alongside supply. USDA’s November 2026 world trade table forecasts Taiwan soybean imports at 2.8 million tonnes in MY2026/27, compared with 2.767 million tonnes in MY2025/26. The forecast describes expected national imports; it is not evidence of a specific buyer order, tender or shipment schedule.
Freight, insurance and vessel availability can change the delivered comparison even when FOB values move in the opposite direction. A buyer comparing US Gulf and Brazilian export points should obtain current freight for the actual loading and destination ports. Do not assume that a lower FOB benchmark will also produce a lower Taiwan landed cost.
4. Which markets import the most soybeans?
4.1 Global importing markets
China is the largest soybean-importing market, while the European Union and other Asian markets are also significant destinations in global trade. USDA’s November 2026 oilseeds report provides country forecasts by marketing year; those projections are not customs results. Taiwan’s forecast of 2.8 million tonnes in MY2026/27 places its procurement within a substantial import program, but the public price benchmarks above do not show Taiwan-specific CIF transaction prices.
4.2 Taiwan’s supplier origins
USDA customs data cited in its Taiwan oilseeds report show the United States and Brazil together supplied almost all Taiwan soybean imports in MY2024/25. The US supplied 55% and Brazil 42%, while Canada supplied 3%. The same report describes a shift from Brazil toward US origin compared with MY2023/24, when Brazil held a 62% share and the US 35%.
Those shares are tied to a specific marketing year and should not be read as current booking data. Importers assessing a new shipment can use them as background, then confirm current supplier availability, origin, loading point and shipment window directly in written quotations.
4.3 Demand forecasts are not buyer orders
A national import forecast indicates expected market demand at country level. It does not confirm which companies will buy, which origin they will select or when cargoes will load. Exporters planning Taiwan offers should treat the USDA outlook as market context and verify commercial requirements with prospective buyers.
5. How Taiwan buyers can compare soybean offers
Compare offers on the same product specification, volume, shipment period and delivery basis. FOB prices cover delivery obligations up to loading at the named export port under the agreed contract terms. CFR adds the cost of carriage to the named destination port, while CIF also includes insurance under the agreed terms. The exact responsibilities depend on the named Incoterm and location in the contract.
- Ask each supplier to state the crop year, origin, grade and any agreed quality limits, including moisture, foreign matter and protein where relevant.
- Match the quantity and shipment window. A price for a different lot size or loading month may not be a useful comparison.
- Confirm whether the offer is FOB, CFR or CIF and name the relevant port. Do not compare a Taiwan-delivered price directly with an FOB origin benchmark.
- Request freight and insurance assumptions for delivered offers, and identify any destination charges that remain outside the quotation.
- Check packaging, bulk or container loading, inspection arrangements, payment terms and quotation validity.
- Calculate the full landed cost using the same currency, quantity basis and destination for each offer.
Taiwan’s International Trade Administration states that official import values are recorded on a CIF basis and export values on an FOB basis. Its trade statistics system covers customs data and provides product-level trade information. Those customs values aggregate transactions and product classifications; they are not equivalent to a current supplier quotation for a defined soybean grade.
Buying consideration: Before choosing an origin, ask suppliers to quote the same specification and destination basis, then compare the resulting landed costs with the shipment schedule and documentation requirements.
6. What does soybean demand look like on Freshdi?
Freshdi buying requests are individual business inquiries, not a measure of Taiwan’s total soybean imports. Buyers reviewing requests should check the stated product, quantity, destination and delivery terms before comparing a request with an export-price benchmark.
A request that does not state a grade, shipment period or delivery basis leaves important pricing details open. Suppliers can use those gaps to ask focused questions before preparing a quotation. National import forecasts and Freshdi requests describe different kinds of demand and should not be combined into one market statistic.
7. Practical next steps for buyers and suppliers
7.1 For buyers and importers
- Use the 12 November FOB figures as origin benchmarks, not as Taiwan delivered prices.
- Send the same written specification and shipment window to each supplier.
- Ask suppliers to identify the export port, Incoterm, quote validity and whether freight or insurance is included.
- Compare current freight and destination costs before judging the lowest landed option.
- Confirm that the supplier’s documents, shipment format and quality terms fit the intended use.
7.2 For exporters and suppliers
- State soybean origin, grade, crop year, available volume and quality parameters in the offer.
- Name the loading port and quote on a clearly identified Incoterm basis.
- Separate the FOB price from any freight, insurance or destination charges.
- Give the shipment window and quotation validity so buyers can compare offers on the same timing.
- Review Taiwan import requirements and the buyer’s requested documents before confirming a shipment.
Buying consideration: Clear origin, specification and delivery terms let both sides test whether a price difference remains after freight and quality requirements are accounted for.
8. How Freshdi supports soybean sourcing
Buyers can use Freshdi to review potential suppliers for soybeans, while suppliers can review buying requests relevant to their products. A marketplace listing or request does not replace checks on product specifications, shipment capability or contract terms.
When comparing potential suppliers, buyers can ask for the same product details and delivery basis from each business. Suppliers can make their offers easier to assess by stating origin, quantity, quality parameters, loading port and quotation validity.
Businesses comparing soybean offers can review relevant suppliers and buying requests on Freshdi.
View Latest Grains, Cereal & Legumes Buying Requests →View Potential Grains, Cereal & Legumes Suppliers →
9. Taiwan soybean market outlook
The latest reported FOB benchmarks for 12 November 2026 rose from the preceding weekly observations, with Brazil Paranagua highest among the three quoted origins and Argentina Up River lowest. USDA’s November report had described a preceding monthly decline as the US harvest and Brazil planting progressed, showing why buyers should keep the observation dates clear when assessing price direction.
Taiwan’s large import requirement keeps US and Brazilian availability relevant to procurement, while USDA’s MY2026/27 import figure remains a forecast rather than a confirmed order book. Buyers should base decisions on current supplier quotations and full landed costs. Suppliers should make origin, quality, volume and delivery terms explicit in every offer.
Buyers can also review soybean buying requests on Freshdi when looking for inquiries that match their product and shipment capability.
Buyers ready to compare offers can review suppliers related to soybeans on Freshdi.
View Related Suppliers for This Product →
Frequently Asked Questions
What was the latest reported soybean export price relevant to Taiwan buyers?
The latest dated comparison located for this update was reported for 12 November 2026. FOB soybean prices were US$501.83 per metric tonne at Brazil Paranagua, US$495.58 at the US Gulf and US$481.71 at Argentina Up River. These are export-port benchmarks, not Taiwan CIF prices or supplier offers.
Did soybean export prices rise in November 2026?
The weekly comparison for 12 November showed increases from the previous observations: about 1.8% for Brazil, 2.2% for the US Gulf and 1.8% for Argentina Up River. USDA’s November report separately described prices declining over the preceding month as the US harvest and Brazil planting progressed. The reported period matters when describing the direction.
Which country supplied the most soybeans to Taiwan?
In MY2024/25, USDA reported the United States supplied 1.51 million tonnes, or 55% of Taiwan’s soybean imports. Brazil supplied 1.17 million tonnes, or 42%, and Canada supplied about 70,000 tonnes, or 3%. These are historical figures for that marketing year, not a statement of the current shipment mix.
How much soybean does Taiwan import?
USDA reported Taiwan soybean imports of 2.77 million tonnes in MY2024/25 and forecast 2.767 million tonnes in MY2025/26. Its November 2026 world trade table forecasts 2.8 million tonnes for MY2026/27. The latter figures are forecasts, not final customs totals.
Are the quoted FOB prices the price buyers pay in Taiwan?
No. FOB benchmarks refer to the named export location and exclude the freight and insurance needed to reach Taiwan. A buyer should compare offers on a common Incoterm and destination basis, then account for freight, insurance, port charges, specification and shipment timing.
How can buyers compare soybean suppliers for Taiwan?
Provide suppliers with the same origin preference, grade, quality limits, quantity, shipment window and destination. Ask each supplier to identify the loading port, Incoterm, quotation validity and included costs. Compare full landed costs rather than ranking offers by an FOB number alone.
References
1. European Commission – Oilseeds Market Observatory, world soybean export prices, 12 November 2026.
2. USDA Foreign Agricultural Service – Oilseeds: World Markets and Trade, November 2026.
3. USDA Foreign Agricultural Service – Oilseeds and Products Annual: Taiwan, 2026.
4. International Trade Administration, Taiwan – Trade Statistics, Updated 17 November 2026.
Disclaimer: This article is compiled from platform data, public sources and information provided by third parties, for general informational purposes only. We do not guarantee its accuracy or completeness. Prices, volumes and forecasts are indicative, reflect conditions as of 2026-11-20 and may change without notice. This is not financial, investment or trading advice.